 Questor
This guide covers the Questor web portal end to end: signing in, queuing repository scans, reading case dossiers, responding to evidence requests, and reviewing portfolio risk. Screenshots come from a live instance scanning OWASP/NodeGoat, an intentionally vulnerable benchmark application.
How Questor validates findings. Instead of emitting raw rule matches, Questor routes every candidate vulnerability through a fixed verification pipeline (Gates A through H): source-to-sink taint path, static exploitability proof, negative control, and impact calibration. Every gate outcome is Ed25519-signed. Candidates that fail validation are recorded as disproven or held as needs-evidence, keeping unverified claims out of your engineering backlog.
This page covers the web portal. For a walkthrough of a single vulnerability investigation, see How it works; for details on the verification pipeline, see Evidence. Full CLI, API, and administration manuals are included with your Questor deployment.
1 · Sign in
Open your Questor portal (qapp.mach41.com/login) and click Sign in with Questor Account. New to Questor? Choose an edition on the Pricing page to register your Questor Account and provision your organization workspace.
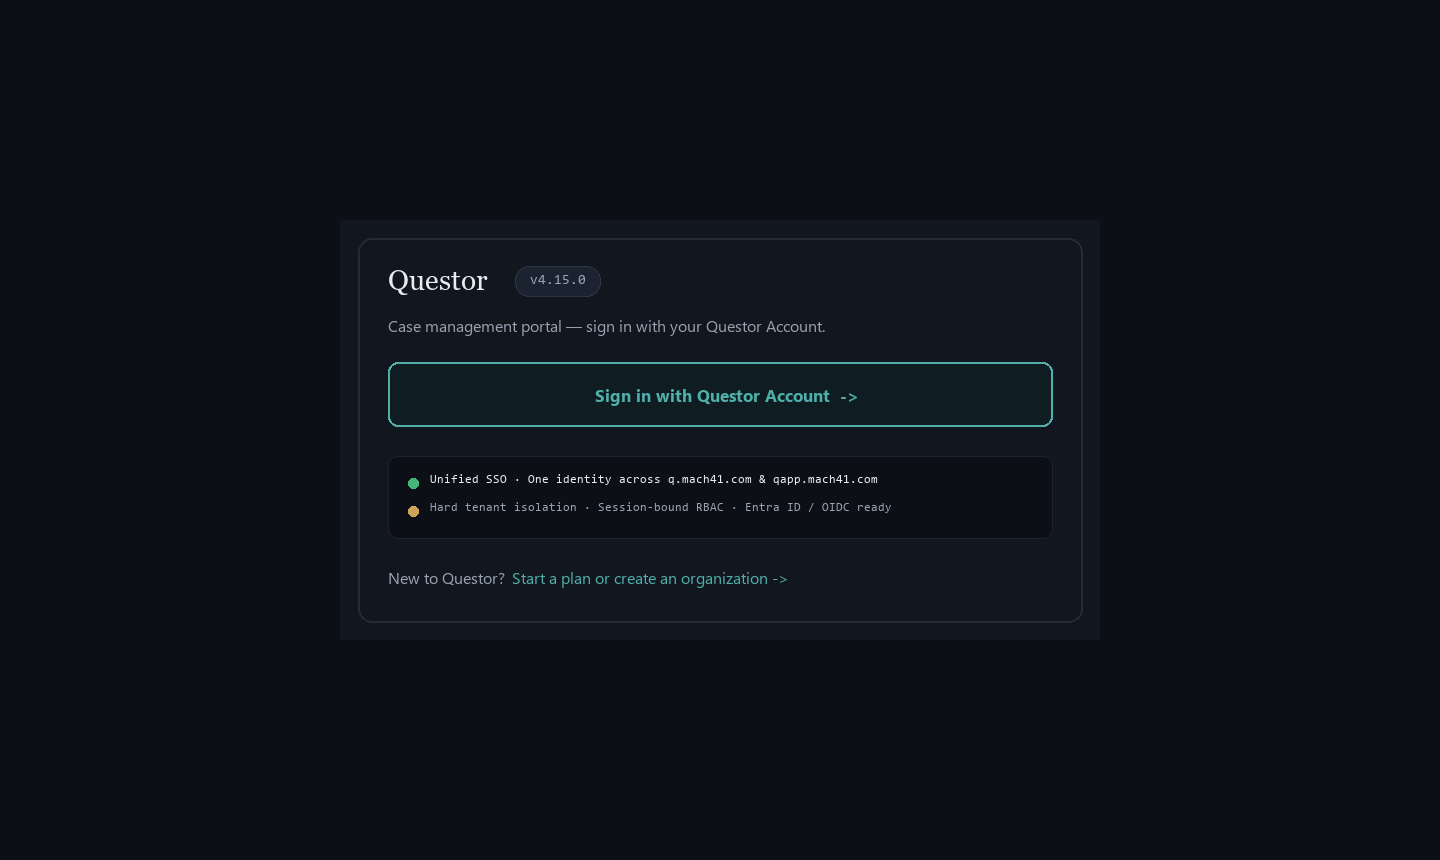
Each workspace is isolated to a single organization. Enterprise plans also support direct identity federation through Microsoft Entra ID or Okta OIDC SSO.
Roles and permissions
Questor enforces four least-privilege roles:
| Role | Permissions |
|---|---|
| developer / defender | Queue scans, review cases, and respond to evidence requests |
| decision_maker | View executive risk summaries, SLA tracking, and sign-offs |
| admin | Manage team members and integrations (cannot trigger code scans) |
To run a scan, sign in with a developer or defender account. Administrator accounts are restricted to user and integration management to maintain separation of duties.
2 · Submit a scan
Open Scans → New scan. Enter a single repository URL, paste a comma- or newline-separated list, or upload a text file with one repository per line. You can optionally set a default ref (branch, tag, or commit SHA; leave blank to scan the default branch), select Force re-scan to bypass deduplication, or enable Also scan related repositories to trace calls across linked services. Click Queue scans.
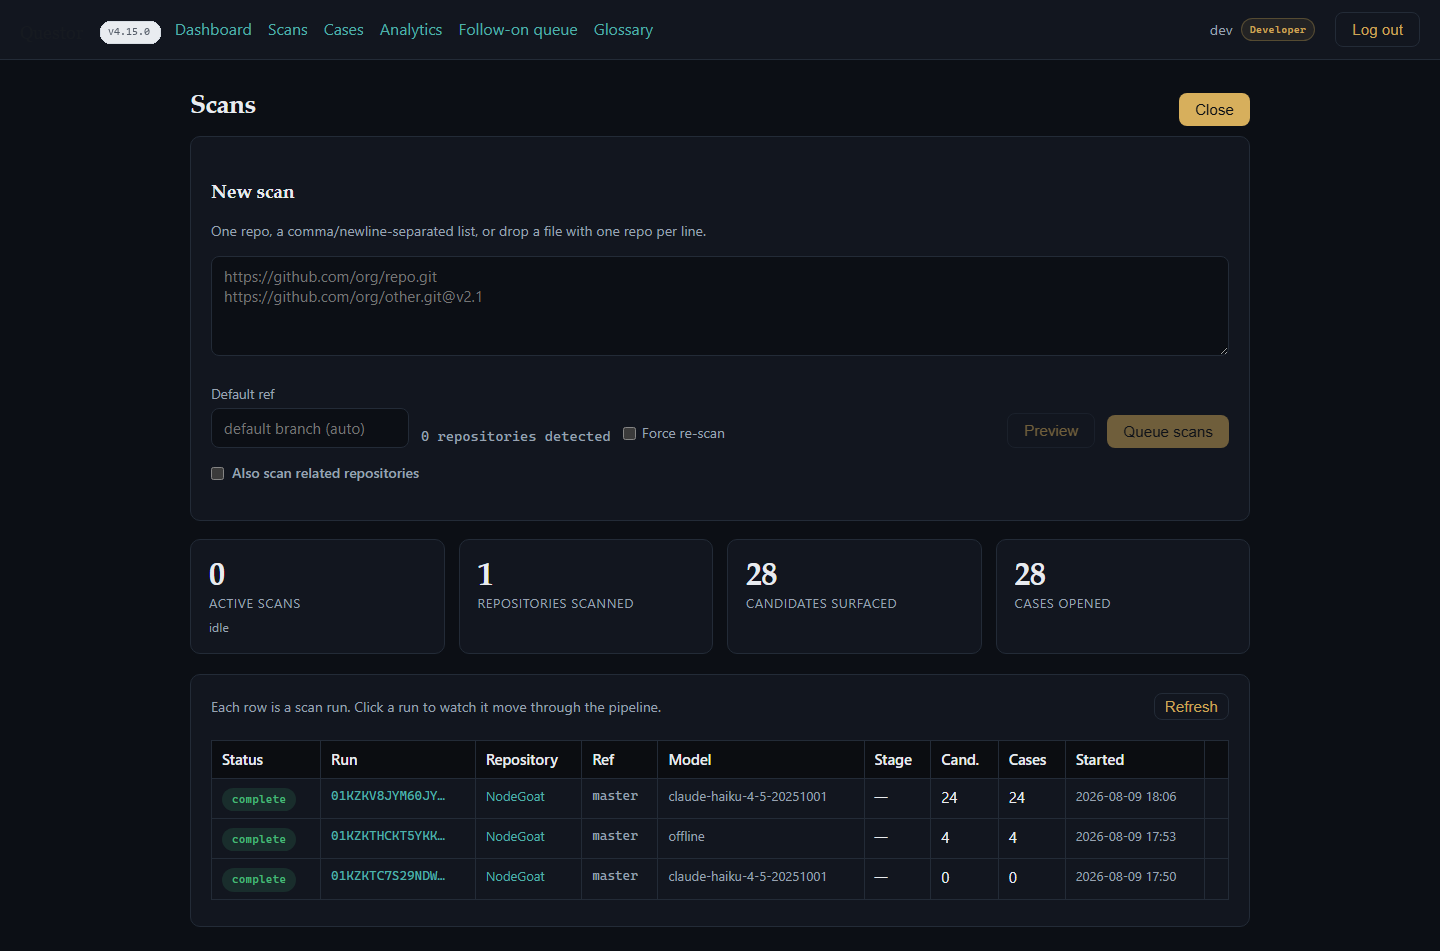
Each row in the table represents a scan run. Select any run to inspect its progress across the pipeline (Stage 0 secret redaction, application mapping, discovery, gate validation, and report readiness). Header cards display live counts for active scans, scanned repositories, candidate findings, and opened cases. The Model column records which inference backend executed the run (for example, claude-haiku-4-5 or deterministic offline mode).
Private repositories, pull requests, and model usage. Private repositories require a read-only access token or the Questor GitHub App, which can also trigger scans automatically on pull requests. Model usage is billed directly by your configured LLM provider with zero markup from Questor.
3 · The Case Registry
Open Cases to view every investigated finding along with its Severity, CVSS score, Status, Title, source Repo, and originating Run. You can search by title or tag, filter by severity or status, and export the view to CSV.
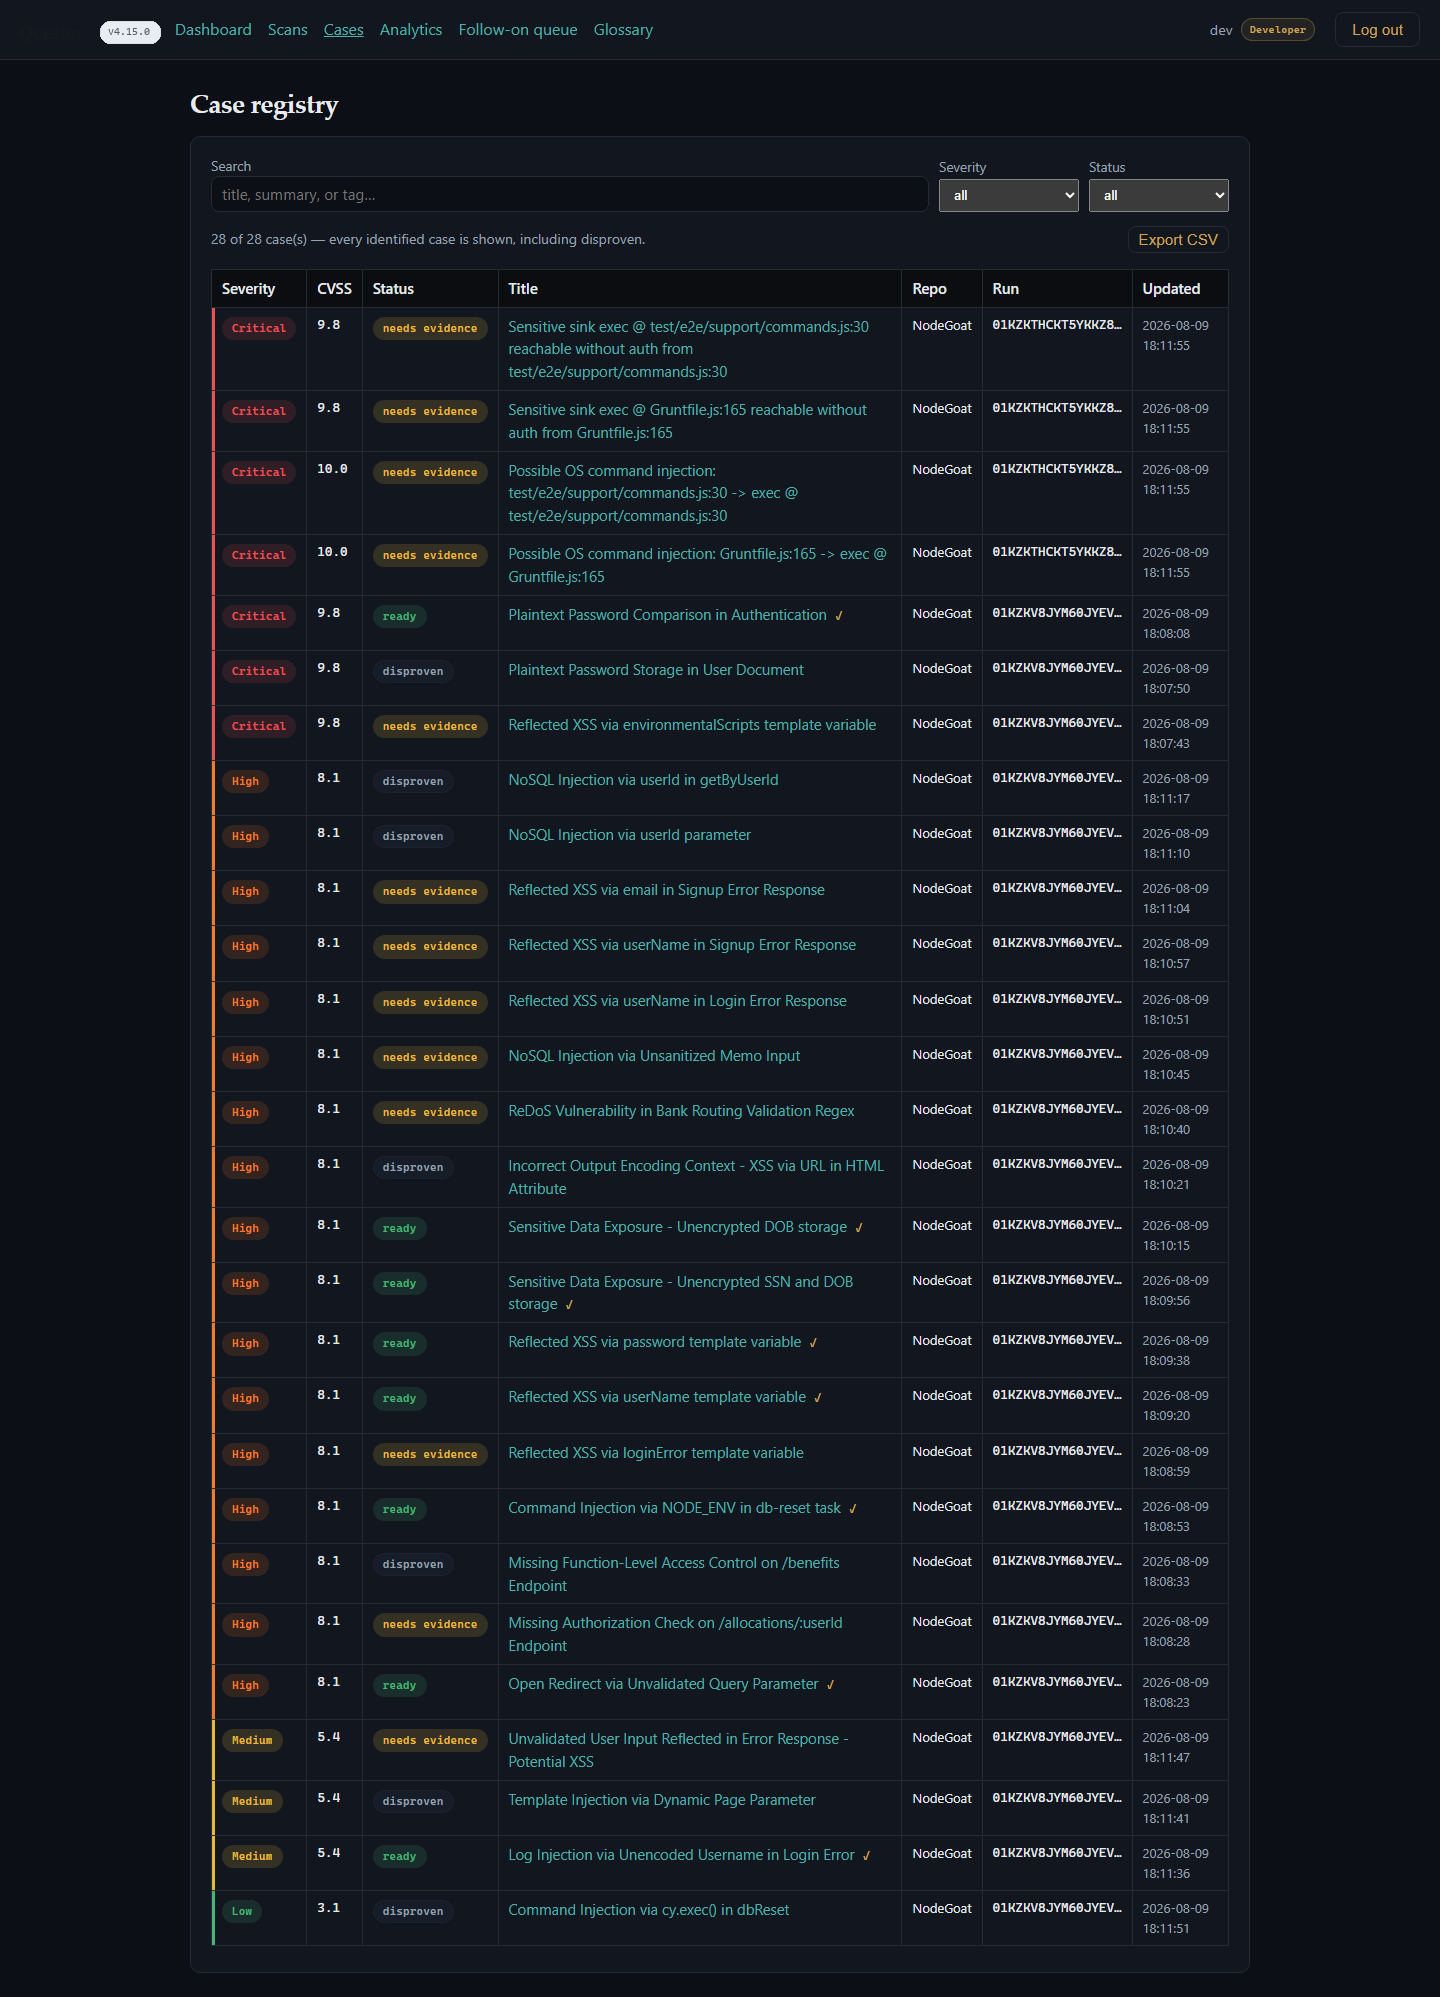
Start with the case status when prioritizing remediation:
| Status | Meaning |
|---|---|
| ready | Passed all validation gates (A through H) with complete evidence. Ready for engineering remediation. |
| disproven | Ruled out automatically by the negative-control check or gate validator. Kept on record for audit visibility; no engineering action needed. |
| needs-evidence | Plausible path identified, but external context (such as gateway auth or deployment config) is required before confirmation (see Section 5). |
In the NodeGoat scan shown above, all three outcomes appear side by side: verified critical findings (plaintext password handling and command injection), filtered false positives (a disproven template-injection candidate), and items awaiting deployment context.
4 · Read a case
Select any case title to inspect the full dossier, trace artefacts, and cryptographic signatures behind the finding.
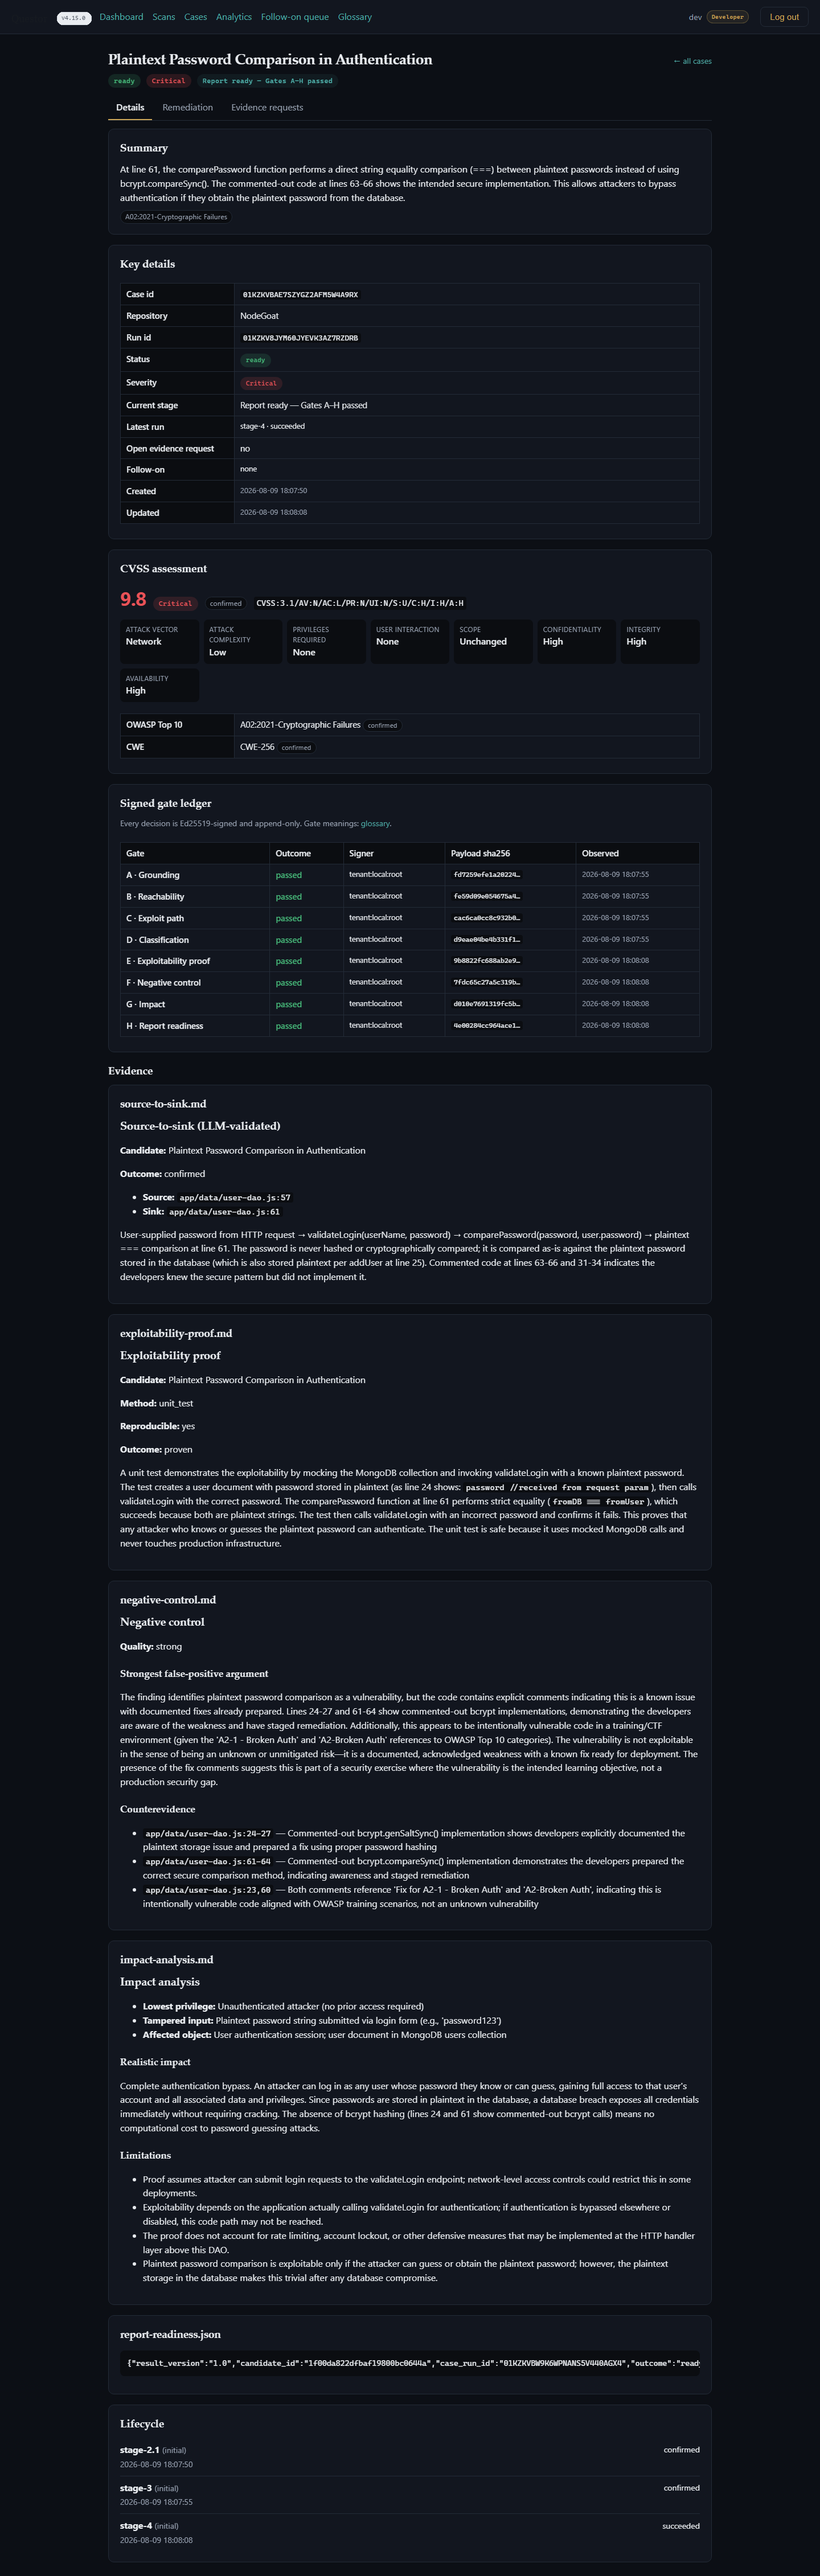
Each case dossier includes:
- Summary and classification: Plain-language technical summary, CVSS 3.1 vector and score (marked confirmed or provisional), OWASP Top 10 category, and CWE identifier.
- Signed gate ledger: Every gate decision (A Grounding · B Reachability · C Exploit path · D Classification · E Exploitability proof · F Negative control · G Impact · H Report readiness) recorded with its outcome, signer key, and payload SHA-256 hash. Entries are Ed25519-signed and append-only so auditors can verify them offline.
- Evidence artefacts:
- source-to-sink: Exact file and line path showing how untrusted input reaches a sensitive sink (for example,
user-dao.js:57 → :61), with step-by-step context. - exploitability-proof: Safe, read-only static verification (
unit_testorstatic_equivalent; Questor never runs live exploits against target environments). - negative-control: Automated check testing whether upstream sanitizers, auth middleware, or type constraints neutralize the vulnerability, along with the counter-evidence.
- impact-analysis: Calibrated operational impact, required privileges, and scope boundaries.
- source-to-sink: Exact file and line path showing how untrusted input reaches a sensitive sink (for example,
- Lifecycle history: Timestamped progression from initial discovery through validation and readiness.
Engineers get the exact code path needed to fix the root cause, and auditors get an independently verifiable record.
5 · Evidence requests
When repository code alone cannot confirm whether an external control blocks a path, Questor opens a targeted evidence request under the case's Evidence requests tab. Submit the missing context in the portal (or via email link) and re-run validation: Questor then either promotes the case to ready or marks it disproven.
6 · Analytics, Board, and Follow-on
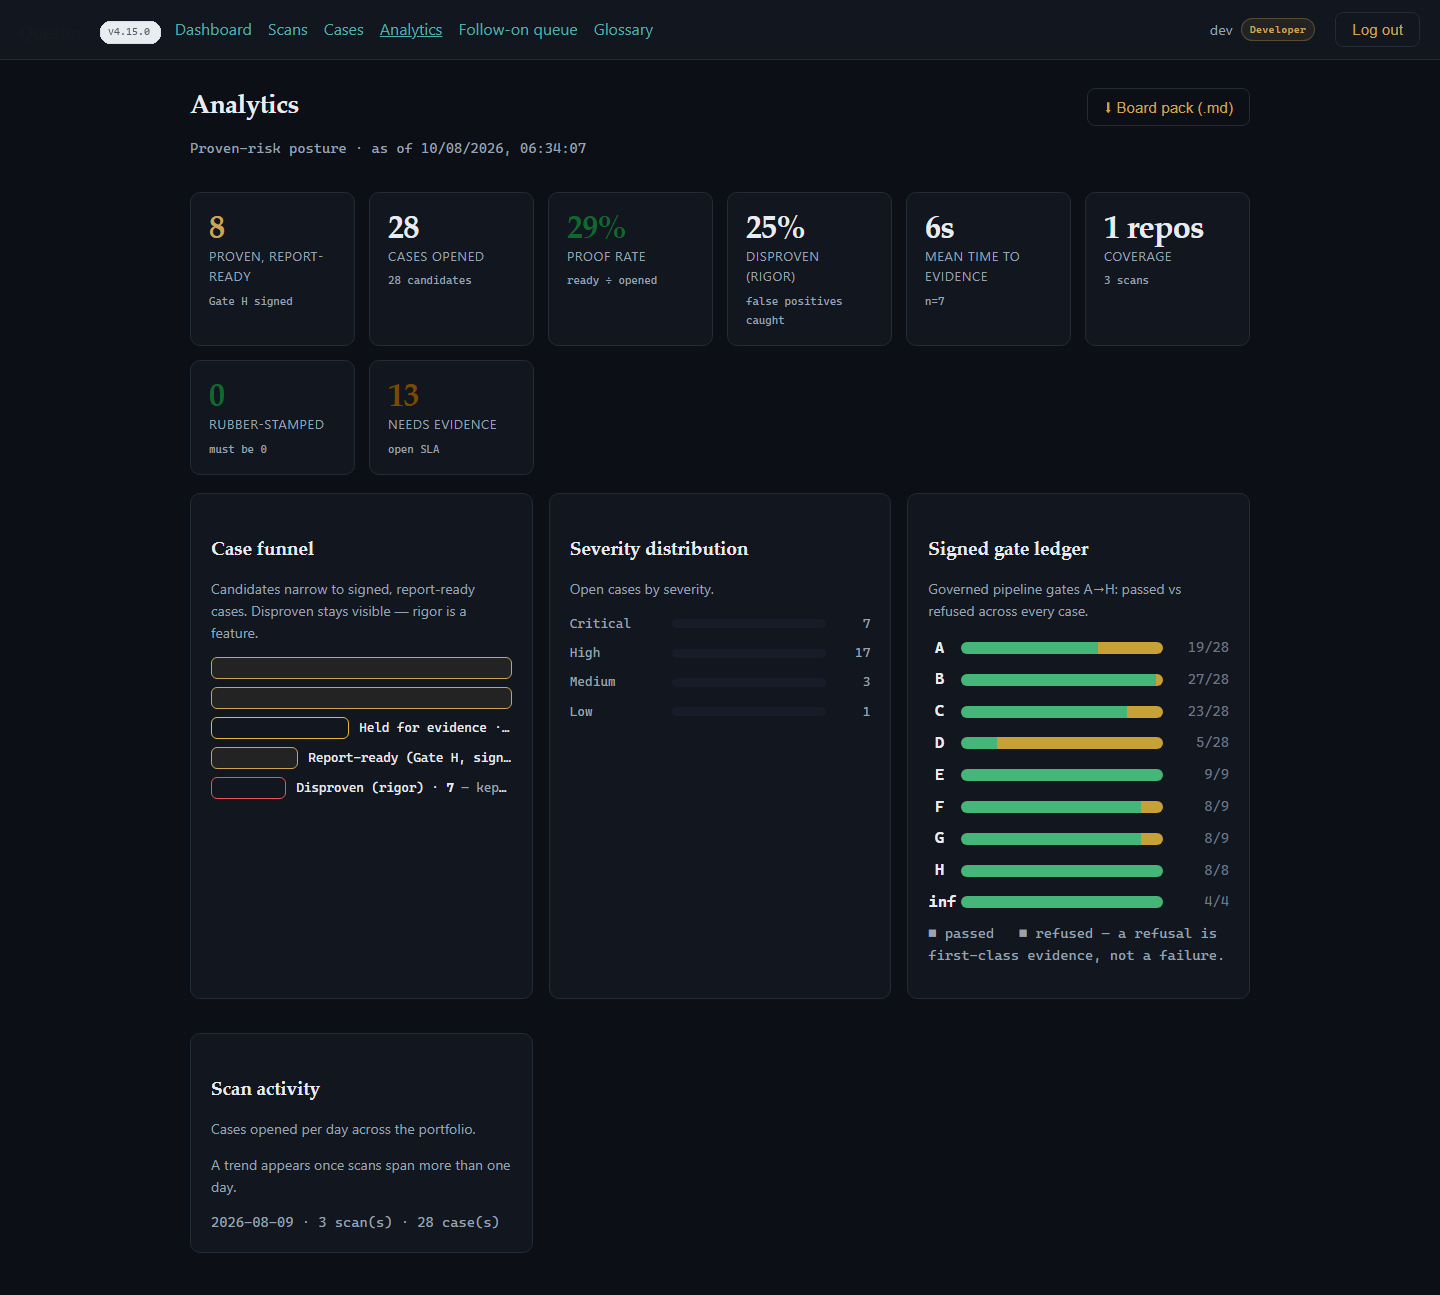
Analytics
Portfolio-wide vulnerability trends, severity distributions, and resolution velocity.
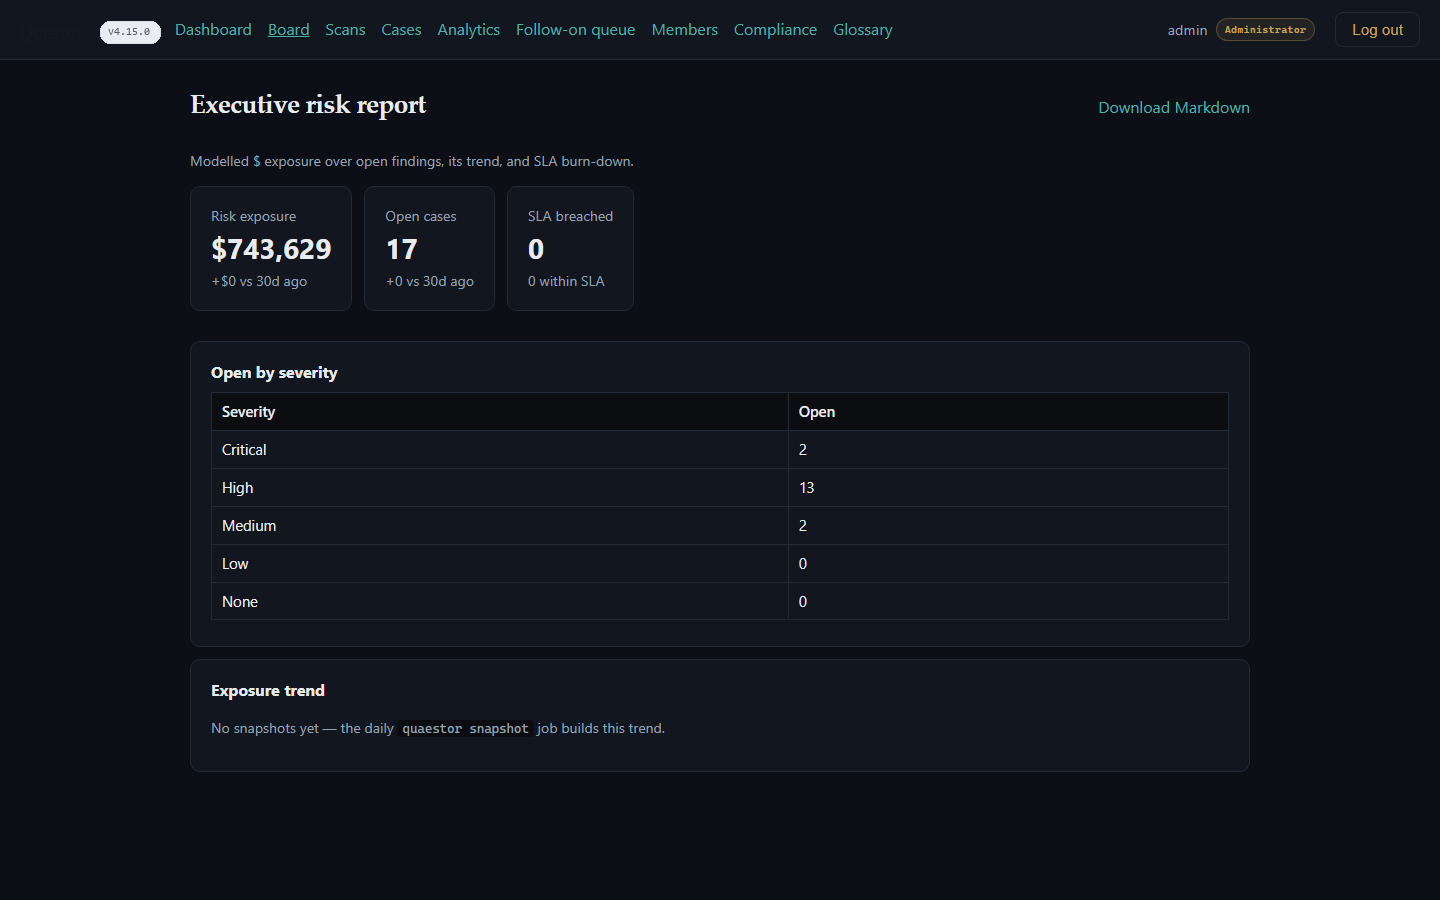
Board
Executive risk view tracking estimated financial exposure, SLA burn-down, and open findings by severity from daily risk snapshots.
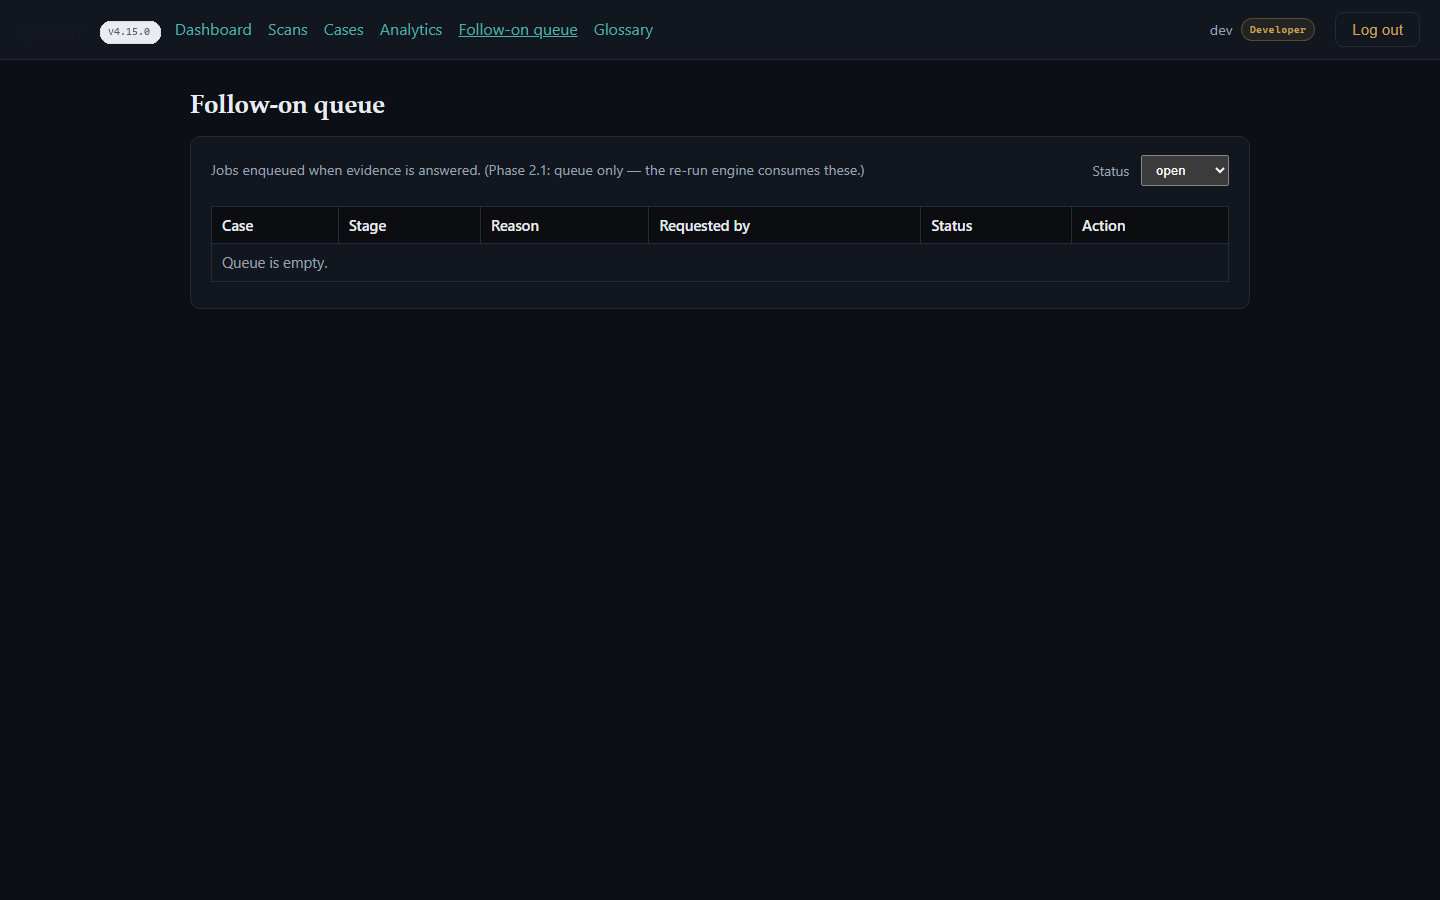
Follow-on queue
Cases scheduled for re-verification or follow-up scanning after code changes.
Verified cases can also sync outward to Jira, export as SARIF, or stream to your SIEM via the append-only audit log API.
7 · Compliance
The Compliance view maps verified cases to common control frameworks (SOC 2, ISO 27001, PCI-DSS, and DORA) to streamline audit preparation. Framework mappings provide audit evidence support rather than formal certification.
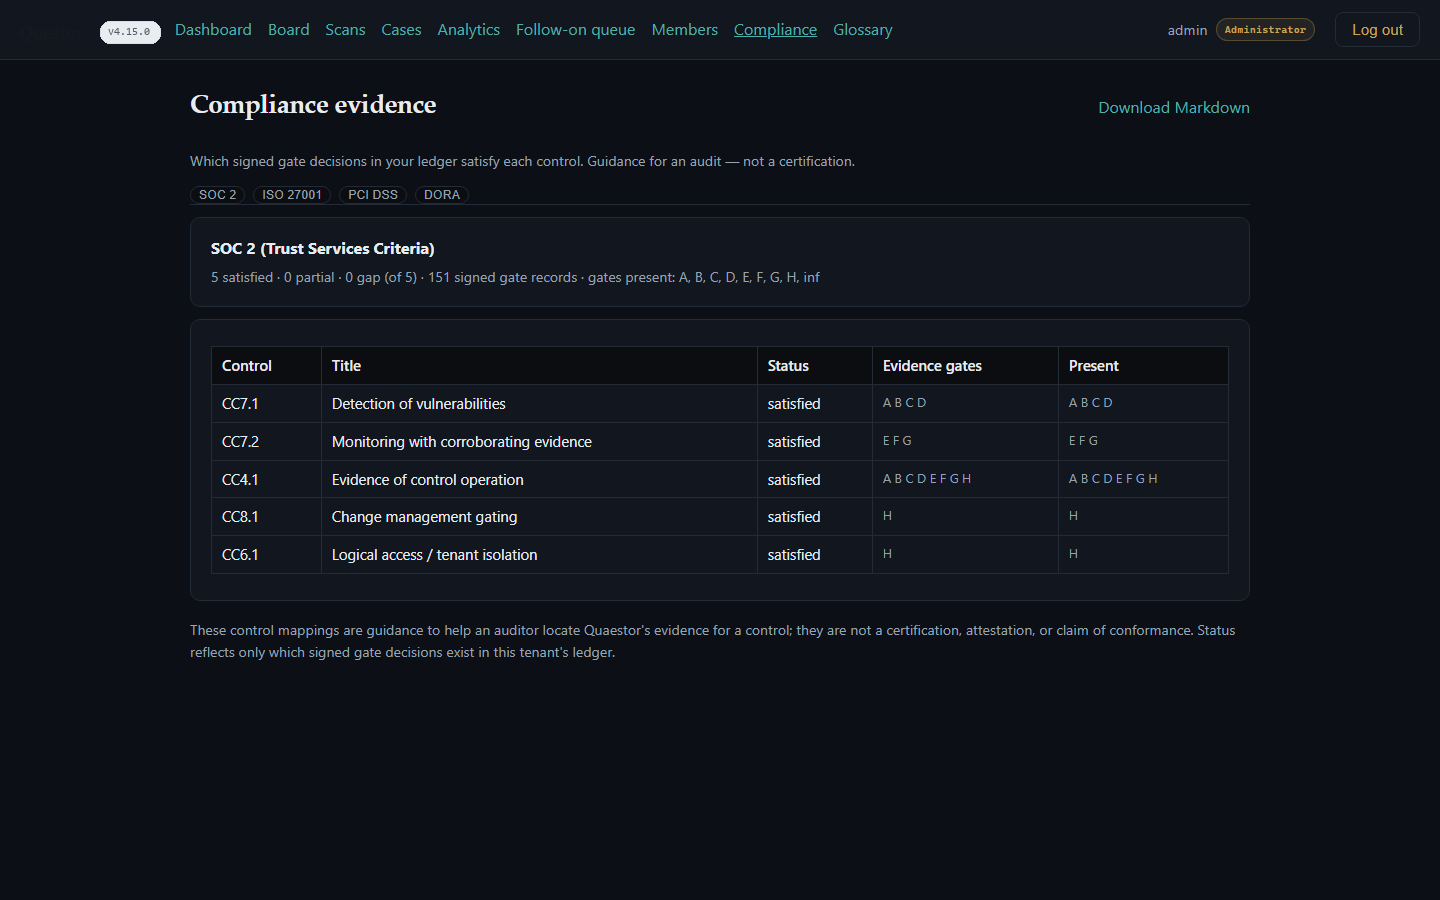
To verify records outside the portal, administrators can export the self-contained audit pack (GET /api/v1/audit/pack) and verify every signature offline using questor verify-gate without database or network access.
8 · Manage your team
Open Members (admin role required) to invite users and assign roles (developer, defender, decision_maker, or admin). Updated role assignments apply on the user's next sign-in.
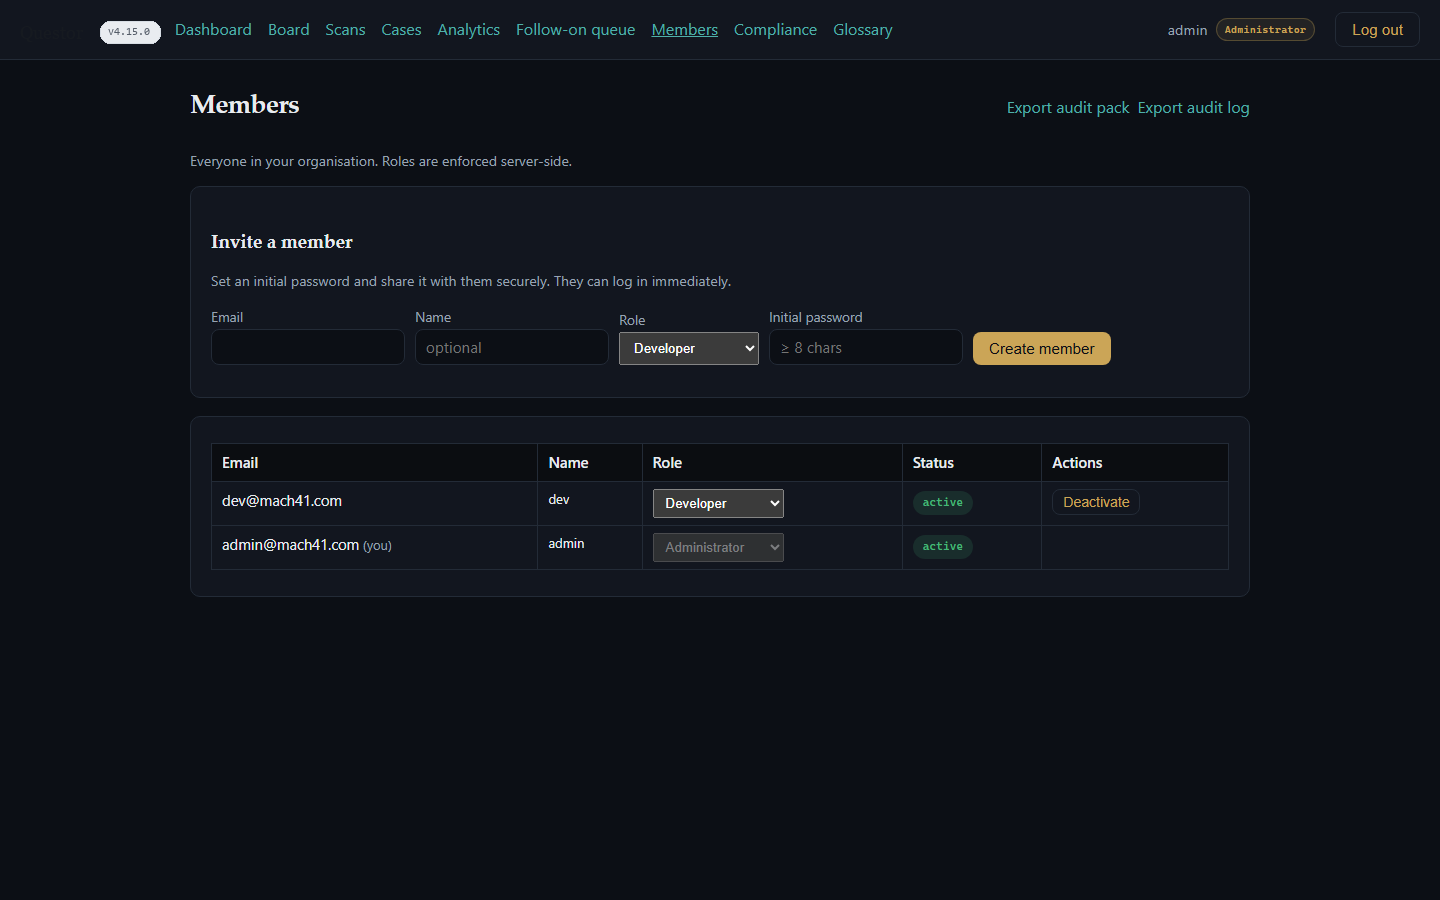
Administrators also configure organization integrations through the admin API and environment settings, including OIDC SSO, the GitHub App, outbound Jira sync, and SCIM 2.0 user provisioning.
9 · Glossary
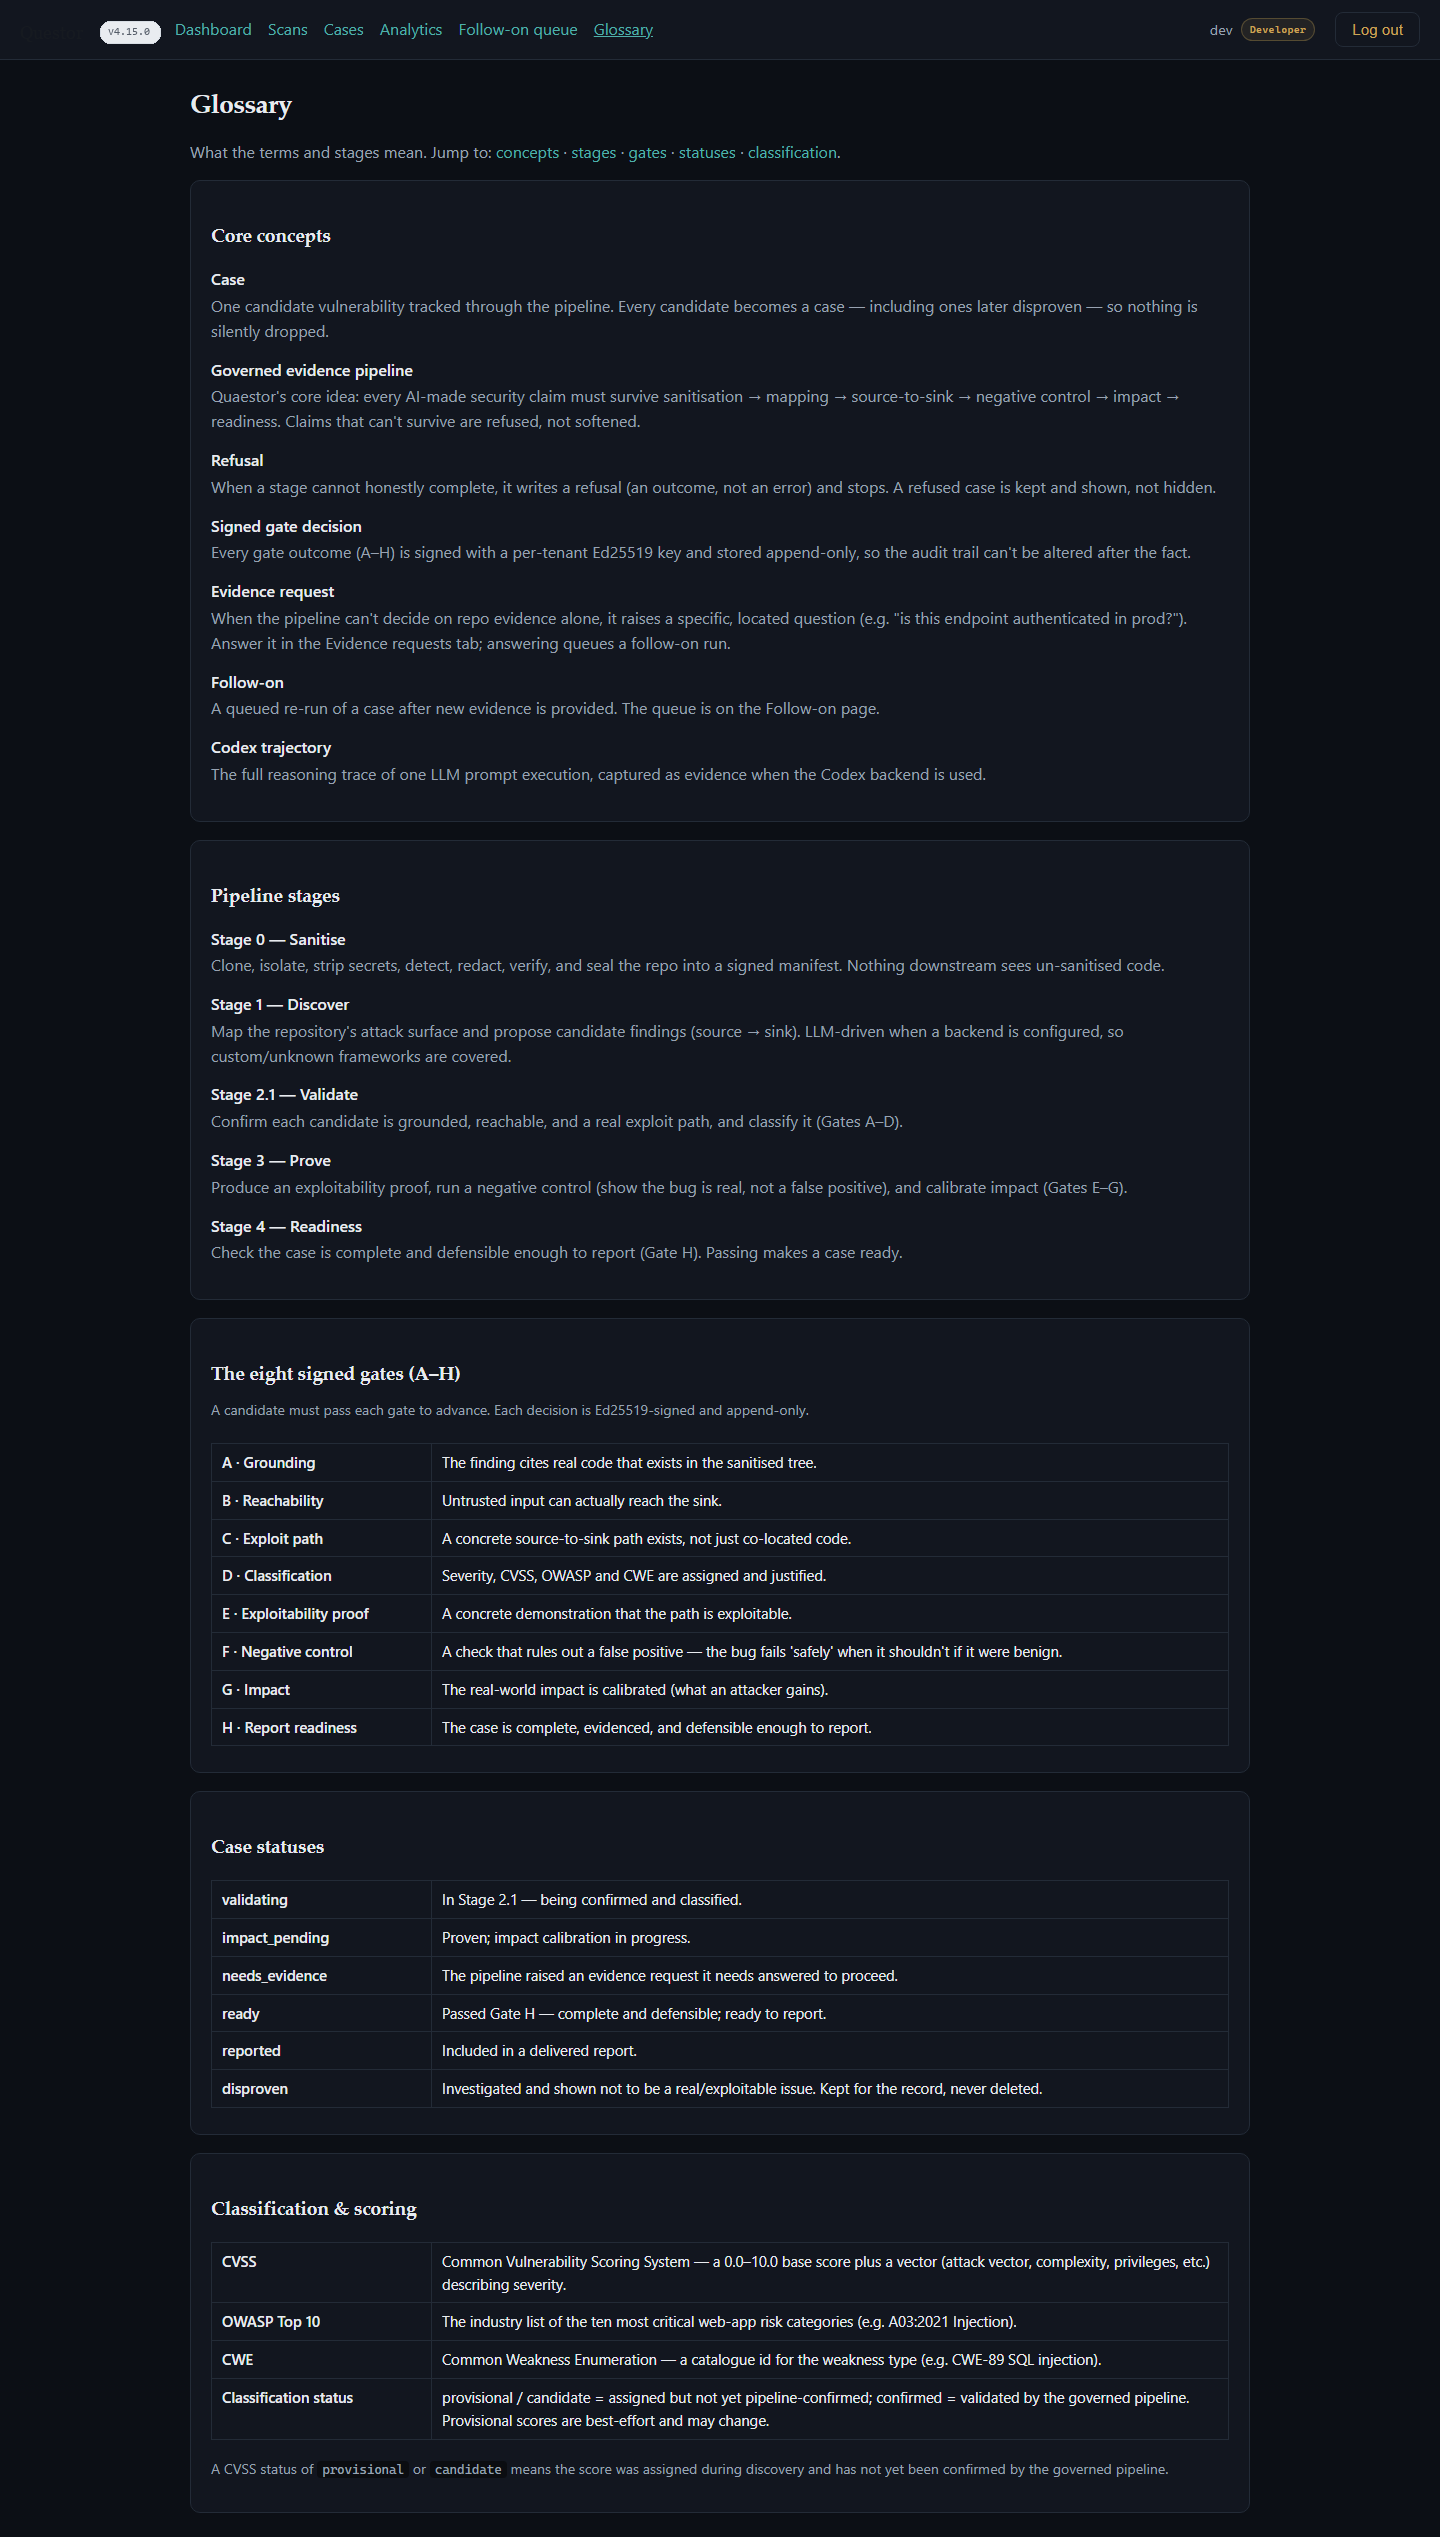
Every pipeline stage, validation gate, and case status is documented in the in-portal Glossary (accessible from the top navigation bar) for quick reference during reviews.
10 · First-run checklist
- Sign in with a developer or defender account.
- Open Scans → New scan, paste a repository URL, and click Queue scans.
- Wait for the run status to reach complete in the scans table.
- Open Cases, sort by severity, and select a ready critical or high finding.
- Review its signed gate ledger, source-to-sink trace, and negative-control result.
- Inspect a disproven case to see why Questor filtered it out.
- Respond to a needs-evidence request and re-run validation.
- Open Board and Compliance to review executive risk and framework mappings.
Ready to scan your own repositories? Request access.
↑ Back to top